The delineation task of the IDTReeS Competition is to define the boundaries of individual tree crown objects (ITCs). Delineation is a common data science problem that involves locating objects or boundaries in images. In addition to being useful on its own, good delineation is often important for classification of objects within images. We are using the term delineation to highlight this task includes the detection of ITCs, and defining the boundary of ITCs. Other terms used in various ecology, forestry, remote sensing, and image processing fields include, segmentation, identification, and detection.
Identifying the position and size of individual trees from remote sensing is useful for understanding forest structure and an important first step in species classification. It is also a complex version of the common image delineation task because trees often overlap each other and look similar, and because the available data is heterogeneous, involving many bands, multiple resolutions, and point cloud height data.
All remote sensing data may be useful for the delineation task. LiDAR data provides information on the spatial variation in canopy height that may allow partitioning of crowns of neighboring trees with similar spectral signatures. Hyperspectral data allows development of spectral signatures to identify object categories (e.g. by assigning spectrally-similar categories to the same cluster). RGB photographs provide finer resolution information (0.10 x 0.10 m as opposed to 1.0 x 1.0 m for the hyperspectral data), which may be helpful to separate trees that are close to one another and to refine boundary placement.
Data split
The data will be split into datasets for training to develop models and testing to evaluate model performance (Table 2). In addition, since this competition will compare how well methods generalize to different forests, different data are provided for the OSBS, MLBS, and TALL sites.
Training Data
Remote sensing data, which includes the hyperspectral, LiDAR, and RGB photos, are provided for the training plots at the OSBS and MLBS sites. ITC data provided are spatial bounding boxes that define each ITC for all plots. The ITC data can be used in any way for developing delineation methods, whether that be directly for supervised methods, or indirectly by evaluating the output of unsupervised delineation method. Field data are provided for all ITCs. Since the TALL site is used as a test of how models apply to untrained sites, no TALL data is provided in the training data. Participants can use the train data for self-evaluation of their methods.
Test Data
Remote sensing data are provided for the testing plots at the OSBS, MLBS, and TALL sites. No ITC or field data are provided for these plots. Participants apply methods developed using the training data to the testing data.
Submission Data
Participants will submit the bounding boxes that delineate the spatial boundaries of ITCs in every 20 x 20 meter plot provided in the testing data.
Submission File:
- Esri “shapefile”: delin_subm.shp, delin_subm.shx, delin_sub.dbf
- OR CSV file with geometry defined using the WKT format: delin_subm.csv
Performance Metrics
There are a few complications in detecting and delineating trees from remote sensing. First, hand-ITCs labelled on RGB images and their boundaries may not be perfectly overlapping with LiDAR or HSI data products; second, being produced remotely there is uncertainty in the quality of the ITC delineation itself. Third, delineations include a number of pixels that are not of the tree crown itself (for example soil, or even neighboring trees). The number of such pixels strongly depends on the orientation and shape of each crown. For this reason, we will measure performance in delineation by using the Rand index, a measure of the percentage of correct decisions made by the algorithm. Participants’ performance on each plot will be calculated using the Rand index. The Rand index will be used to provide a measure of similarity between two delineations of a plot (i.e., the similarity between the ground-truth and the submission). To account for small uncertainties and inaccuracies in the size of the ITC delineations, when we compute the Rand index, we will use a set of “halos” around each truth location during scoring. The Rand index can be computed as follows:
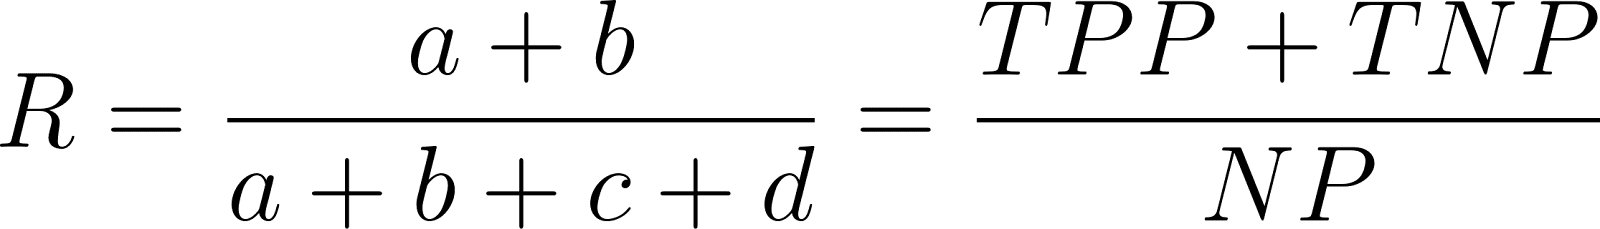
where a is the number of pairs of agreements between the results and the inner halo from the ground truth, b is the number of pairs of agreements in the area between the outer halo and edge halo in the ground truth and the results, c is the number of pairs of disagreements between the results and the portion between the outer and edge halo from the ground truth, and d are the number of pairs of disagreements between the results and the inner halo of the ground truth. The value of a can be interpreted as the number of true positive pairs and b as the true negative pairs, while c is the number of false positives, and d are false negative pairs. An illustration of the halos is shown in the figure below.
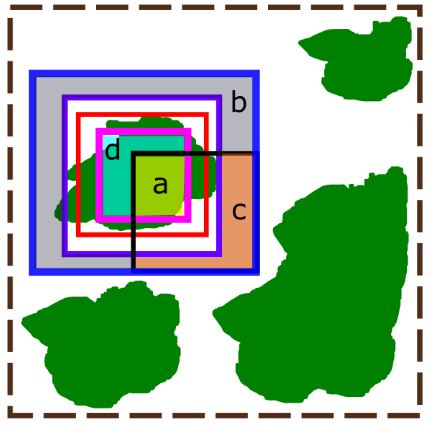
An illustration of how crown delineations are scored. The green polygons represent individual tree crowns, the red box is the ground truth delineation, and the brown dashed box is the full 20 x 20 meter plot. Within the ground truth delineation is a pink box and this is the inner halo. Outside of the ground truth delineation is a purple box and this is the outer halo. The most outer blue box is the edge halo. The black box is a sample delineation. The true positives are shown in the yellow highlighted region (marked with an “a”). This is the intersection of the detection and the inner halo. The true negatives are the blue highlighted region (marked with a “b”). This is the difference between the edge halo and the outer halo and the detection. The false positives are in the orange highlighted region (marked with a “c”). This region shows the portion of the detection that is encompassed in the negative region between the edge and outer halo. The false negatives are in the teal highlighted region (marked with a “d”). This region shows the difference between the inner halo and what was detected in the outer halo.
To keep this score balanced, the inner and outer halos is set to be 10 cm within (1 pixel in the RGB imagery data) and outside of the ground truth, and the edge halo is computed so that the area between the edge and outer halo is the same size as that of the inner halo. Predicted bounding boxes that have no overlap with a ground truth bounding box will be given a score of 0. Code for assessing this scoring is provided as a Python package with the following function used to assess the Rand score:
Score = RandScore(CrownPredictions, GT)
where GT is a numpy array with inner and outer halo locations for each crown and CrownPredictions is a numpy array where each row corresponds to a single crown, the first two columns correspond to the upper left pixel location of the crown bounding box and the second two columns correspond to the lower right pixel location of the crown bounding box (row, column).
Each predicted bounding box is assigned to a ground truth bounding box based on the greatest overlap. In cases of ambiguity of correspondence between predicted crowns and crown locations in the ground truth, we will use the one-to-one mapping that provides the best score for the submission. This will be accomplished using the Hungarian assignment algorithm.
We will also calculate mean intersection over union scores (IoU), defined as the area of overlap between the ground-truth bounding box and predicted bounding box divided by the area of union. IoU is the most common metric of bounding box accuracy in object delineation, and ranges from 0 (no overlap) to 1 (perfect overlap). Since IoU does not allow for easy incorporation of an uncertainty “halo”, it will be used as a secondary score. The overall score for the delineation task is the average IoU for each plot (the IoU’s of all ITCs in a plot will be averaged).
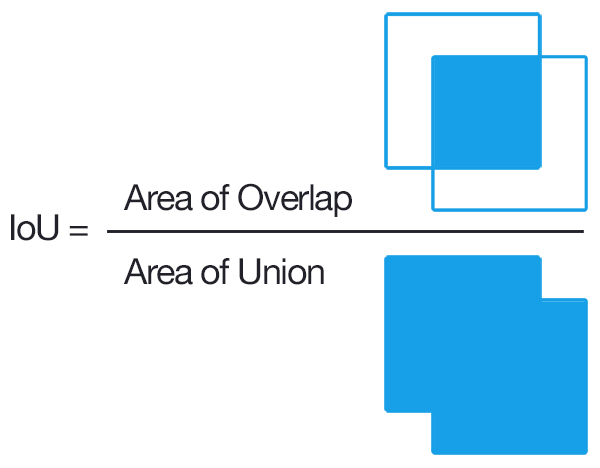
Diagram of Intersection over Union (IoU) metric used in the evaluation of delineation task submissions.
The overall score for this task is the average IoU for each plot (the IoU’s of all trees in a plot will be averaged). In cases of ambiguity of correspondence between predicted crowns and crown locations in the ground truth, we will use the one-to-one mapping that provides the best score for the submission. This will be accomplished using the Hungarian assignment algorithm.