Thanks to all those who participated in this competition! This page contains a summary of the results for the IDTReeS 2020 competition for the delineation and classification tasks, and a list of teams. The 2020 competition ran from March to August 2020.
Delineation
The delineation task is to define the boundaries of individual tree crown objects (ITCs). Identifying the position and size of individual trees from remote sensing is useful for understanding forest structure and an important first step in species classification.
Evaluation metrics
Intersection over union (IoU) – the area of overlap between the ground-truth bounding box and predicted bounding box divided by the area of union. IoU was used because it is a common evaluation metric in delineation tasks because it is easy to measure and interpret.
Rand Index – The ratio of the true positive pairs and true negative pairs to the number of negative pairs. The Rand Index was used because the border of a crown is not precise. The score is less sensitive (than IoU) to minor differences in the delineation with a buffer area around the true delineation.
Team scores for the delineation task
| Team | Mean IoU | Mean Rand Index |
| Fujitsu Satellite | 0.63 | 0.86 |
| Intellisence_CAU | 0.36 | 0.61 |
| INRAE-GIPSA | 0.18 | 0.21 |
Details for each submission (listed alphabetically)
Teams with an * have indicated they are interested in publishing their methods in a peer-reviewed scientific journal as part of a collective submission for this competition. The structure will follow the structure of the 2017 competition paper collection: https://peerj.com/collections/56-remotesensingcomp/.
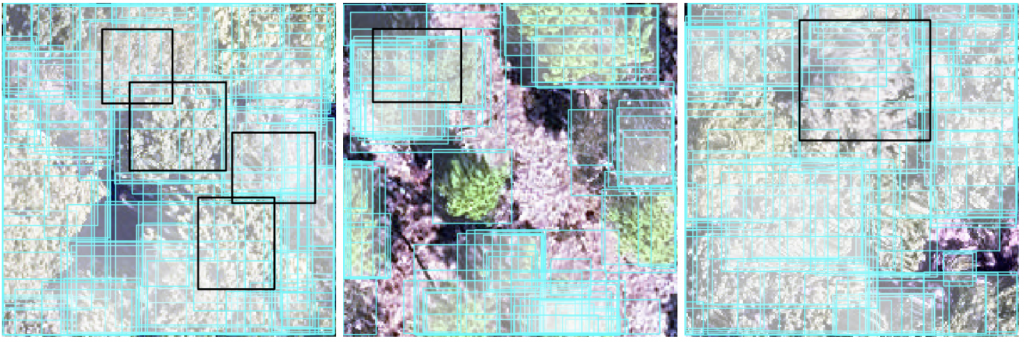
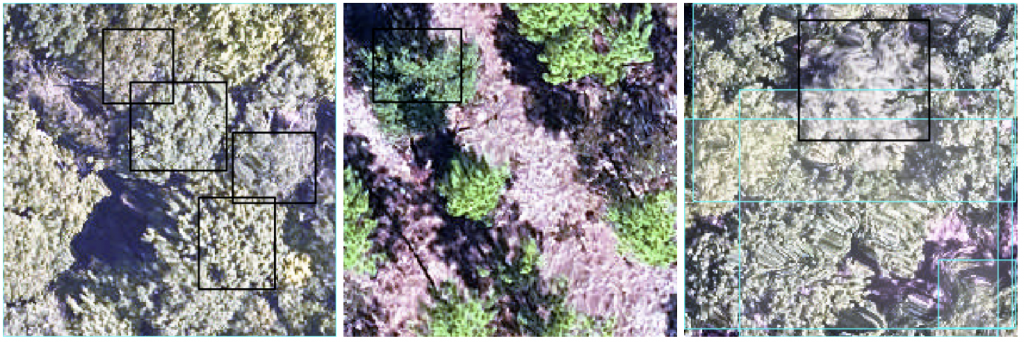
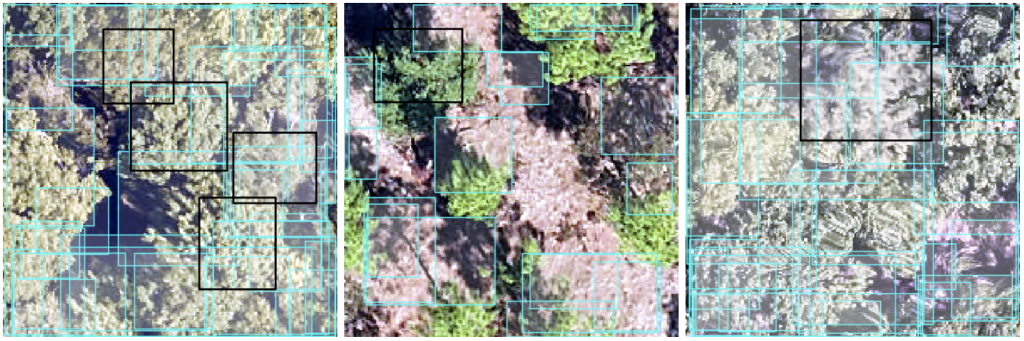
Delineations are boxes with a cyan line with partially transparent white fill. Field ITC delineations (ground truth) used to evaluate team delineations are boxes with a black line and no fill. One plot from each site is presented (from left to right: MLBS, OSBS, TALL)
Fujitsu Satellite team: Our approach is based on deep neural networks (SOTA detection and instance segmentation models, such as HTC and DetectoRS). We used CHM data to filter obvious false positive predictions. Data used: RGB, HSI, and CHM
INRAE-GIPSA team*: We present an adaptive 3D mean shift (AMS3D) algorithm, whose parameters are estimated based on allometry equations for defining the ellipsoid crown shape model and deriving the kernel profile size. Data used: LiDAR point cloud
Intellisence_CAU team: We use RGB images to train a Faster-RCNN detector. TTA is used to improve the results. Data used: RGB
Classification
Classification is a common data science problem that involves determining object membership in a set of categories. Describing the density and distribution of different species using remote sensing would allow these efforts to occur more rapidly and at larger scales than field sampling.
Evaluation metrics
There are many relevant ecological questions that warrant the use of multiple evaluation metrics, and at multiple levels of detail. We report scores for three different evaluation metrics and for 3 levels of evaluation. These evaluations consider test data from both sites that included training data (OSBS, MLBS) and novel sites with no training data provided (TALL).
Macro F1: The F1 metric averaged across all classes equally. This metric was used because while the dataset contains highly imbalanced data (as is common in ecological datasets of species), there may be applications where all classes are of equal importance. Therefore, the method should not favor common classes over rare classes.
Weighted F1: The F1 metric averaged across all classes and weighted by the number of samples in each class. This metric is used because the high imbalance in the data is a reflection of the distribution of species in the ecosystem, with come species being very common and others being rare. Therefore, it may be best for a method to favor the most common classes as the expense of the rare classes.
Cross-Entropy: A metric to compare two probability distributions. This metric was used because it rewards participants for submitting well-calibrated probabilities that accurately reflect their uncertainty about which crowns belong to which class. Capturing this uncertainty is useful when new classes are introduced.
Team scores for the classification task
This evaluation includes all crowns, does not group by genus, and contains many new classes (these classes were not known to participants). All teams except GatorSense had at least 2 evaluated pre-submissions. Bold text indicates top score for each metric.
| Team | Macro F1 | Weighted F1 | Cross entropy |
| Fujitsu Satellite | 0.28 | 0.45 | 3.92 |
| Intellisence_CAU | 0.22 | 0.39 | 9.08 |
| Más JALApeñoS | 0.12 | 0.33 | 2.50 |
| Jeepers Treepers | 0.07 | 0.31 | 11.62 |
| GatorSense | 0.09 | 0.32 | 24.38 |
Methods for each submission (teams listed alphabetically)
Teams with an * have indicated they are interested in publishing their methods in a peer-reviewed scientific journal as part of a collective submission for this competition. The structure will follow the structure of the 2017 competition paper collection: https://peerj.com/collections/56-remotesensingcomp/. The GatorSense team participated in the last competition and published a paper with their methods.
Fujitstu Satellite team: We used a 4 layer fully connected neural network to train a hyperspectral point classifier. This is used as a feature in a clustering algorithm. A tree level feature is obtained by the distribution of the point feature in the clusters. Then a fully connected NN classifier is used to make the final tree classification. Data used: HSI
GatorSense team: We used Multiple Instance Learning with distribution (MILd) which aims to learn a Gaussian Mixture Model (GMM) distribution for each species class to capture the spectral variability. A soft classification is estimated for each testing ITC based on the votes from all pairwise classifiers. For some ITCs with almost the same votes on all species classes, these ITCs are predicted as ‘Other’. Data used: HSI
Intellisence_CAU team: We used a 1dcnn applied to pixel values extracted from the hyperspectral data. To cope with the imbalanced data, the data was resampled by randomly selecting 400-600 samples per class. Outliers were removed using the CHM (mainly for the OSBS site). Data used: HSI and CHM
Jeepers Treepers team*: We used a neural network to combine information from the RGB, hyperspectral, and lidar data. First, we generated rectangular RGB image chips for each crown and trained a convolutional neural network to generate a taxon ID probability vector for each crown. We concatenated this probability vector with the hyperspectral data extracted at crown centroids, and with pseudo-waveform data derived from the lidar point cloud. This concatenated feature vector was passed to a second neural network that learned to fuse the RGB, hyperspectral, and lidar data together. We trained this neural network to minimize a custom “soft F1” loss function, and then post-processed the uncertain predictions from the model by assigning nonzero probability to an “other” category. Data used: RGB, HSI, and LiDAR point cloud
Más JALApeñoS team*: We transformed values of the hyperspectral remote sensing imagery (PCA) to predict species identification with a gradient boosting algorithm. Species with few individuals were grouped into an “other” category. Classification was done at the pixel-level then scaled to the crown-level. Data used: HSI and canopy height data for the ITCs that had corresponding field data
Team information
Fujitsu Satellite, Fujitsu Laboratories, Japan
GatorSense, University of Florida, USA
INRAE-GIPSA, University Grenoble Alpes, France – Eduardo Tusa (eduardo.tusa-jumbo@inrae.fr), Jean-Matthieu Monnet, Jean-Baptiste Barré, Mauro Dalla Mura and Jocelyn Chanussot
Intellisence_CAU, China Agricultural University, China
Jeepers Treepers, University of Colorado Boulder, USA – Victoria Scholl, Joseph McGlinchy, and Max Joseph from the Earth Lab
Más JALApeñoS, Yale University, US – Luke Browne (lukembrowne @ gmail.com), Sergio Villegas Estrada, Jasmine Liu, Alexander Polussa, Megan Sullivan, Akshay Surendra